As much as I would like to barrel ahead and do super cool exciting analytics with the hockey data that I’ve been exploring in the last several posts, I’m simply not ready yet. The exploration process is not complete and I discovered (so far) one problem that requires me to enhance my data a bit. But that’s to be expected. Most data has flaws of one sort or another, so the trick is to find and fix those flaws where possible.
In today’s post, I have two objectives. First, I have covered a lot of ground in the last few posts, so I want to step back and restate the overall exploration process that I’m focused on right now. In addition, I want to more narrowly define my data analytics goals for my first project. Second, I want to start digging into the details of data that I thought appeared unusual when I created my first round of simple statistics.
You can rewind to the beginning of the series by starting here and then following the pointers at the end of each page to the next post in the series.
The Data Exploration Process
As I mentioned in my last post, I am currently in an exploratory phase with my data analytics project. Although I would love to dive in and do some cool predictive analytics or machine learning projects, I really need to continue learning as much about my data as possible before diving into more advanced techniques.
My data exploration process has the following four steps:
- Assess the data that I have at a high level
- Determine how this data is relevant to the analytics project I want to undertake
- Get a general overview of the data characteristics by calculating simple statistics
- Understand the “middles” and the “ends” of your numeric data points
Step 1: Assessing the data
For my analytics project, I’ve decided to limit myself to the data that I can obtain freely by using the NHL statistics API (https://statsapi.web.nhl.com/api/v1). There are other data sets out there with additional data points, but I’m happy to work with official data right now and see how far I can get.
Here’s what I have cobbled together so far in Power BI:
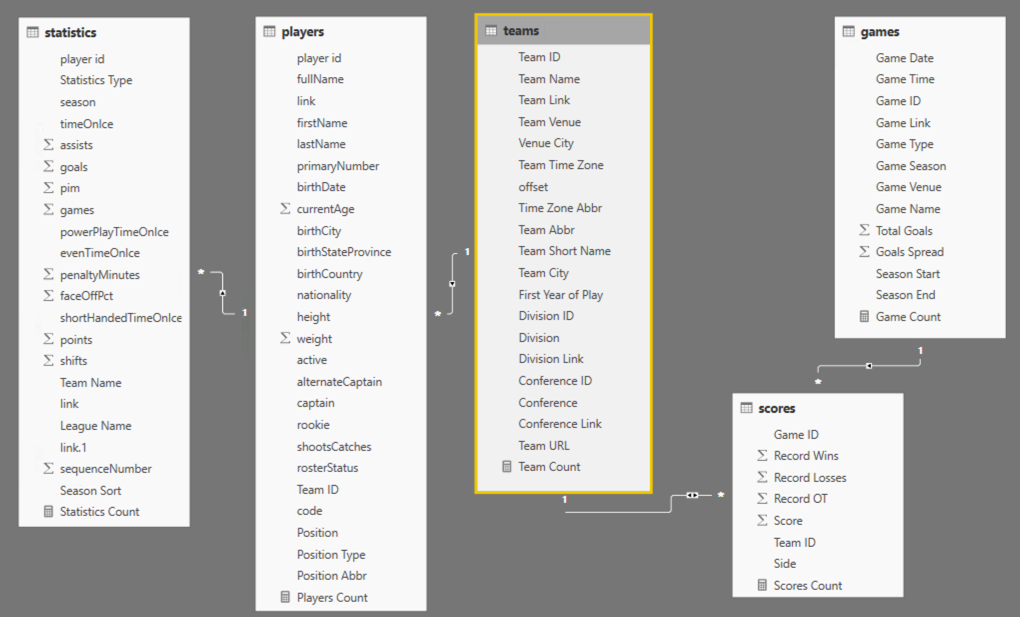
Each rectangle in the diagram above represents a query that forms a table in the Power BI model:
- statistics – Information about a player’s statistics by season, such as number of goals scored or games played. The majority of this data appears to come from season 2009-2010 and later, with the 1993-1994 as the earliest season.
- players – Information about each player and his position in the current season.
- teams – Information about each team, its location, and association with a particular division and conference.
- scores – Final scores for each game since the first season, 1917-1918. This data has not been evaluated for completeness.
- games – Information about each game, including date, time, teams, and calculated values for total goals and goal spread, since the first season, 1917-1918.
I know that I can still go back to the NHL statistics API and get team level statistics and play details from games, but I’ll save that analysis for another day. For now, I think that I have enough to work with in a variety of ways from visual analysis to predictive analysis, machine learning, and pattern-finding.
Step 2: Determining which data is relevant to my question
There’s a lot of data to use here. It can get overwhelming to try to explore it all at once. So I need to narrow down what I want to do with the data to determine which is relevant for each type of analysis that I want to perform.
As an example, the initial question that launched me into a search for hockey data and to learn what I could do with it began with an assumption about whether or not a particular game was high-scoring. To help answer this question, I need to know what a typical score looks like, what’s low, and what’s high over time.
The calculation of an “average” in my first post is one way to find out what’s typical. (I know… averages are not always the right measurement to use. More on that in a future post.)
By using analytics, I can answer multiple related questions. By knowing what an average score looks like, I know by extension whether a score is high or low. And then I can use that information to discover whether certain teams have a propensity for high scores or low scores and whether that changes over time, and so on.
For these types of questions, I only need the teams, scores, and games data sets. The player and player statistics data isn’t helpful for those types of questions… yet. Later, I could incorporate this other data to try to determine to what extent the players and their statistics influence high scores, but… baby steps.
Clearly I could go off in a zillion directions, so it’s important to define scope for each project. For now, I’m limiting the scope of my analysis to game scores. And Power BI makes this process pretty easy.
Step 3: Review the characteristics of the data with simple statistics
I began this process in my last post in which I introduced the initial group of simple statistics—counts for categorical variables and minimum, maximum, average (mean), and median for numerical variables. I set up tables of these simple statistics organized by data set and reviewed the results in Power BI which you can also see in that post.
Data is sometimes dirty. Or reveals something unexpected. The initial review process using simple statistics can help you figure out what needs to be fixed, what new avenues for exploration might be beneficial, and whether the unexpected is actually a new insight.
To review, here is the list of anomalies I’ve already noted in the categorical variables in the games table:
• There are 127 games without a venue.
• The number of games per season seems to be increasing over time. Probably more teams were added over time which resulted in more games. However, as I scroll through the values, I see a significant drop in the number of games in the 1994-1995 and 2012-2013 seasons.
• There is an interesting spread of start times for games, such as 12:30 am or 4:30 am. Really?
• There are venues for which only 1 game was played, or a really low number.
Also, I noted the game types have abbreviations that I don’t understand. I needed to look those up and add the full name for the game type at some point.
Step 4: Review the “middles” and the “ends” of numeric data
Distribution of data can be quite informative about your data set. I’ll get more deeply into distribution in a future post. For now, I want to focus on the middles – which are the average and mean values for the games and scores tables as described in the previous post.
Here I’m again looking for reasonableness of the values and thinking about what these values suggest, that further analysis would confirm or refute.
The other two statistics, average and median, tell me a bit about the middle parts of the data from two different perspectives. The official term for the middles is central tendency.
I notice these values are fairly close together numerically which tells me that the data isn’t heavily skewed. I’ll explain more about skew in a future post, but in general it tells me that I don’t have a lot of rows in the data set that have a value significantly higher or lower than the average value.
Next, I’m interested in assessing the “ends”, also known as the extremes:
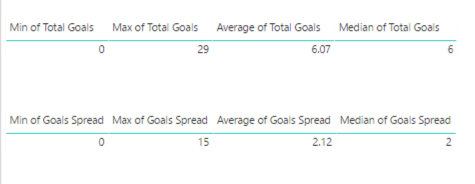
- Total Goals minimum of 0 seems odd – because hockey games do not end in ties. I would expect a minimum of 0 so I need to determine why this number is appearing.
- Total Goals maximum of 29 seems high – it implies that either one team really smoked the opposing team or that both teams scored highly. I’d like to see what those games look like and validate the accuracy.
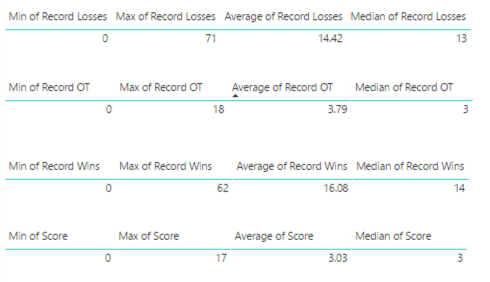
- Record Losses minimum of 0 seems odd also – that means at least one team has never had a losing season?
- Similarly, Record Wins minimum of 0 means one team has never won?
- Record OT minimum of 0 – I’m not sure how to interpret. I need to look.
- Score minimum of 0 seems to imply the same thing as Total Goals minimum of 0, which I have already noted seems odd.
Or maybe it’s just me and my relative newbie-ness to hockey that finds some of this data odd. I’ll find out eventually as I put on my detective hat!
Data Investigation: Missing Venues
Now I want to use Power BI to dig more deeply into the details of my data to determine its accuracy and decide whether I need to take additional steps to clean the data. Today I’ll take on the case of the missing venues.
My quick approach to analyzing Venues is to duplicate the Games Categorical Variables page in my report
and then I delete the tables except the one showing the game count by venue. Next, I apply a Visual Level filter to the visualization to include only the blank venues and add in the Game Season field to see what’s up with the data.
I notice that the majority of issues are in the 20052006 season. I wonder why?
![]()
Then I add the Game Name field to see the games, such as Anaheim Ducks @ Los Angeles Kings 9/17/2005. (In fact, I notice all the games look like preseason games by the dates. Hmmm.) My assumption is that this game should be at the Los Angeles Kings venue, and that each missing venue is the venue associated with the home team.
First, I want to validate that the venue data is missing from the source, and yeah, the venue information is indeed missing. I still don’t know why. I’d have to understand how the NHL statistics API compiles its data, but at least I know at this point that nothing that in my process created this problem.
A little search on the Internet confirms that this particular game was in fact played at the home arena for the Kings, Staples Center. I’m not inclined to look up every single game, but I’m okay with going out on a limb and assuming that the home team’s arena should be inferred. I’m also going to add this information as a separate column so that I can use either the original data from the NHL or my inferred data.
To fix the missing venues by populating a value based on the home team, I performed the following steps:
- In the Query Editor, I created a getVenue function to use the teams query, filter by a specific team id, and return the team’s venue.
- I discovered during this process that two teams from the 2005-2006 season no longer exists, Phoenix Coyotes and Atlanta Thrashers. So I manually entered the Team ID and Team Venue for both teams into a table called other teams. Later I discovered some pre-season games were played in the 2008-2009 and 2009-2010 seasons and added those arenas as well. I found the relevant Team IDs in the API for schedule.
- I modified my function to include a step that appends the manually created table to the intermediate table used in the function. I thought the final code for the function would look like this:
(teamid as number) as table =>
let
Source = teams,
#”Removed Other Columns” = Table.SelectColumns(Source,{“Team ID”, “Team Venue”}),
#”Appended Query” = Table.Combine({#”Removed Other Columns”, #”other teams”}),
#”Filtered Rows” = Table.SelectRows( #”Appended Query”, each [Team ID] = teamid),
#”Removed Columns” = Table.RemoveColumns(#”Filtered Rows”,{“Team ID”})
in
#”Removed Columns”
- I wanted to update the getGames function to call this function so that it returns an additional venue column, but… I ran into a problem. I cannot call a function that itself calls a function. If I do, I get the following error:
Formula.Firewall: Query ‘getGames’ references other queries or steps, so it may not directly access a data source. Please rebuild this data combination.
- Now what…? I removed the step in the getGames function that removes the id.1 column (as I demonstrated in the first post in this series although it was just a table at that time). The id.1 particular column represents the home team id. End result – the id.1 column is included in the results when the getGames function is called.
- Then I updated the games query to ensure the id.1 column is in the results when the table returned by getGames is expanded.
- Next I added a step to call the getVenue function in a custom column called Alt Venue, then expanded the table that the function returns to include the result in the games query. But then I got that error again about referencing other queries or steps and needing to rebuild the data combination… Grrr! When I created the getVenue function, I was referencing the teams query for efficiency, but that’s an indirection that isn’t allowed either.
- So, I replaced the line of code referring to the teams as the source with the entire code of the teams query and kept all the other lines of code in place.
- I then updated the #”Removed Other Columns” to a new name and changed the argument in the RemoveColumns function…The relevant portions of code now look like this:
(teamid as number) as table =>
let
Source = Json.Document(Web.Contents(“https://statsapi.web.nhl.com/api/v1/teams”)),
. . . <removed lines to focus on the relevant changes> . . .
#”Removed Columns3″ = Table.RemoveColumns(#”Changed Type12″,{“franchiseId”, “active”}),
#”Removed Other Columns” = Table.SelectColumns( #”Removed Columns3″,{“Team ID”, “Team Venue”}),
#”Appended Query” = Table.Combine({#”Removed Other Columns”, #”defunct teams”}),
#”Filtered Rows” = Table.SelectRows( #”Appended Query”, each [Team ID] = teamid),
#”Removed Columns4″ = Table.RemoveColumns(#”Filtered Rows”,{“Team ID”})
in
#”Removed Columns4″
- Last I removed the id.1 column from the games query. I don’t need it anymore. Whew! Done!
![]()
Although I wrote the steps above sequentially, the process was really iterative process. Find a little, fix a little, find some more… round and round we go.
After my first attempt at a fix, I still saw games with missing venues. It turns out these were all exhibition games that were pre-season. Most of them were out of the country, with one exception – the Dallas Stars @ Texas Stars game. I had think about how I want to handle this situation. My options:
- I might consider deleting these rows from the data set and just be done with them altogether.
- Or I might come up with a flag to denote them as different in some way, and then I can filter them out on demand. I’m not inclined to delete data too early in the process.
- Or I can look up the arenas and manually update the other teams table. This is what I decided to do. And now I have arenas for each game listed in the Alt Venue column.
But… I can see if I add Game Venue back to the table that the Alt Venue column doesn’t always match when Game Venue is not null. Hmm – more to think about how I want to handle.
For now, here’s a link to the PBIX file if you want to take a closer look.
In the next few posts, I’ll tackle the other anomalies and likely continue making adjustments to my data set queries and the Power BI model. Stay tuned!
5 Comments
[…] data analytics in a future post. Stay tuned! Lots of future posts to come! In the meantime, my next post starts to address issues that I see in the […]
[…] Stacia Varga takes a step back from analyzing NHL data to explore it a little more: […]
[…] For now, Power BI continues to my tool of choice for my project. My goals for today’s post are two-fold: 1) finish my work to address missing venues in the games table and 2) to investigate the remaining anomalies in the games and scores tables as I noted in my last post. […]
[…] I began the first pass through my data, I built tables to explore the “middles” and “ends” and promised that I […]
[…] Assessing where data is potentially missing and figuring out why […]