In my last post, I described a problem I had working with an R script in Power BI for which the cause was not obvious (at least to me). In this post, I want to share with you what I was doing with R in the first place that led me to that particular problem.
Nothing particularly earth-shattering. As part of my latest Pluralsight course, I was preparing a demo to show how you can use R in Power BI. One way is to use an R script to get data into Power BI for analysis and another way is to use it to generate a visualization.
For my demo in the course, I used National Oceanic and Atmospheric Administration (NOAA) data to compare average afternoon temperatures by month for two different years and created a script to grab the necessary data by using the rnoaa package.
For the Pluralsight course, the R script uses hard-coded values for the location (which happens to be my home town, Las Vegas) and time period. If I want to view data for a different place or different years, I need to modify the R script.
It’s not difficult, but the cool thing about Power BI is that I can use parameters to dynamically change the report visualization without opening up the script. To do this:
- Open the Query Editor in Power BI
- Click Manage Parameters, and then click New Parameter.
- Set the parameter properties – Name, Type, and Current Value.The Name is how I will reference the parameter my R script, the Type is the data type, and Current Value is the initial value that I want to set (if any).
I set up 3 parameters as follows:
| Name | Type | Current Value |
|---|---|---|
| Station | Text | 724846 |
| WBAN | Text | 53123 |
| Years | Text | “2016”, “2017” |
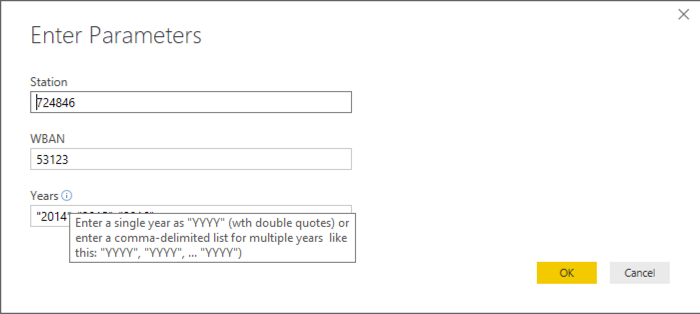
Here’s the Parameters dialog box showing all 3 parameters, with the details for Station.

And here’s the Years parameter, which includes a description:

Parameters can be used in many different ways in Power BI – to change a data source or change filter values or even replace values in a query based on parameter. You can also reference query parameters in DAX expressions and you can use query parameters in report filters. In this case, I’m going to plug the parameter values into the R script. The easiest way to do this is to open the Advanced Editor and replace the hard-coded values with parameter names.
Here’s the beginning of the script as it appears in the Advance Editor:
let
Source = R.Execute(“library(“”rnoaa””)#(lf)#(lf)station <- c(“”724846″”)#(lf)wban <- c(“”53123″”)#(lf)years <- c(“”2016″”, “”2017″”)…
Notice in the R.Execute function that the R script is just a big long string with new lines appearing as #(lf). To use the parameters, I simply need to concatenate the script and the parameters together, as shown below. (I’ve used bold font to show the changes I made.)
let
Source = R.Execute(“library(“”rnoaa””)#(lf)#(lf)station <- c(“”” & Station & ““”)#(lf)wban <- c(“”“& WBAN & ““”)#(lf)years <- c(“& Years & “)…
Now when I close the editor and view the report, everything works just as if I had hard-coded the values in the script. But now the fun part. To change the values, I click Edit Queries on the ribbon and then click Edit Parameters to open the dialog box shown below in which I can now type in new values. The parameter for which I added a description has a little symbol next to it that displays the description when I hover the cursor over the symbol.
This is all well and good, as long as I know the station and WBAN values that I want to use. I have a document I downloaded from the NOAA site to look them up, but I could set up other R scripts to get the full list of possible values from which I could choose. That will be another post!

8 Comments
[…] Stacia Varga shows how you can parameterize your R scripts within Power BI: […]
Thank you Stacia. I was able to use this technique for the newly integrated Python scripts as well.
Hi Neelanjan,
Unfortunately, there is lack in examples of passing variables to the Python.Execute function. I cannot seem to figure out how to pass variables to the Python.Execute. Could you maybe explain how you have done this for Python?
Thanks in advance.
Kind regards,
Claire
can I achieve the same goal using Python?
In theory, it should work. The key really is to use concatenation in the string that gets passed to a function and to replace any hard-coded value in a function argument with a reference to the parameter.
Hi Stacia,
Thanks for this detailed post. It looks really promising especially since there are almost no articles that provide a solution to this problem. They always conclude that for example you just have to load the complete dataset and then filter later pased on query parameters.
For my bachelor thesis I am trying to integrate diagnostic modelling in Power BI. Currently, I have a Python package . However, in my case I want to run a function from a own created package which performs a diagnostics analysis. Creating a data set with all possible analysis would be inefficient. Therefore, I wrote a Python script in the Power Editor that uses the function. However, I need to have dynamic input. Unfortenately, the parameters values are not recognized in the Python.Execute.
Could you explain how to deal with this in Python? I read your reply to Neelanjan, but I do not understand what you mean with concatenation in the string that gets passed to the function.
Thank you in advance.
Kind regards,
Claire
Hi Claire,
What I meant by concatenation in the string would be to have something just like I show in the post above where I replace the values like
”724846″
with
& Station &
and so on for each hard-coded value. In the case of R.Execute, the entire argument is a string and should resolve by placing the parameter values in the respective locations. I would expect the same behavior with Python.Execute.
I’m in the middle of a project right now so I’m not in a place where I can set up a scenario and test it myself. Let’s say you had something like this:
Source = Python.Execute(“… python code…..
r = (some dataframe)
r.myFunction(myParam)”)
Can you change it to this:
Source = Python.Execute(“… python code…..
r = (myDataFrame)
r.myFunction(” & myParam & “)”)
Be careful with quotes, especially if your parameter requires single or double quotes. (In my experience – it’s the quotes, commas, and parentheses that get you most of the time and not the logic you’re trying to implement. )
Is there a way to set up the parameters you created that are passed to the R script as slicers that the user can change then refresh so they are passed into the r script after refreshing? When I add the created parameter as a slicer to the home page, only the currently selected value appears as an option.