Currently I’ve been wrapping up production on Business Intelligence in Microsoft SharePoint 2013 (which includes chapters on Excel 2013) and preparing for my upcoming Deep Dive into Business Intelligence in Excel 2013’s PowerPivot and Power View eLearning event (among other things). Consequently I’m paying a bit more attention than usual to what the universe has to say about this latest release of Excel. Ok, maybe not the universe, but people are talking and one of those people is someone I happen to know, none other than Rob Collie (blog | twitter). Rob has a bit more insight than most of us because he was one of the engineers that developed the PowerPivot functionality that was originally integrated with Excel as an add-in installation in Excel 2010, but is now built directly into Excel 2013. So when Rob speaks, I listen.
In a recent Software Advice interview, Rob hits the highlights of the new Excel by answering questions about BI functionality in Excel, the message about self-service BI that it sends, the motivation for users to upgrade, the impact of Office Apps, and his vision for Excel users. I agree with Rob’s contention that having PowerPivot (and of course Power View) available directly in the product is going to help users discover this functionality faster than they would if they had to rely on finding, downloading, and installing an add-in. However, I do have a concern that this functionality still might not be obvious. Although PowerPivot is built into Excel now, it’s still considered an add-in, and furthermore it’s disabled by default. To use it, you have to enable the PowerPivot add-in, which isn’t difficult but isn’t necessarily obvious.
So I’m not sure that people are going to discover PowerPivot on their own without the PowerPivot tab of the ribbon enticing them to explore. But they might happen to notice changes to the Import Data dialog box that mentions the Data Model.
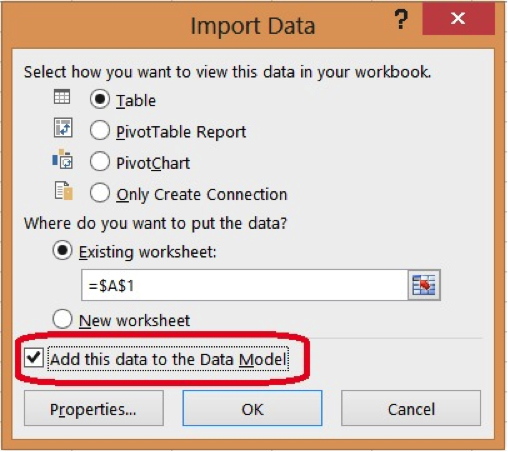
The Data Model gives you an entry-level path to PowerPivot. You can bring together data that you can use to build Power View sheets in Excel, the other great new feature in Excel 2013. Although there is also some set up required before you can use Power View, the process is a bit smoother. When you first attempt to insert a new Power View sheet, Excel prompts you to enable the add-in and also to install Silverlight. As long as you have data in the Data Model, you’re off and running.
So how does that relate to PowerPivot? Well, the Data Model is simple, based on the data you feed it. Power View allows you to build great visualizations, but what if you want to refine the model by renaming a field or adding a calculation? When users decide the basic Data Model isn’t enough, that’s when they’ll want to learn more about the Data Model and discover that PowerPivot takes them deeper into data analysis.
As Rob mentions, I don’t think this capability makes every user a data analyst, but Excel 2013 provides something for everyone. Those users who just need simple spreadsheet calculations can do just that, while others who would like to explore and enhance their data with visualizations have some amazing capabilities without having to take a week’s worth of training, and those who are already comfortable with embedding advanced formulas into a worksheet will quickly learn and take advantage of the features in PowerPivot that support richer modeling of the data. It’s great to see the evolution of Excel, and especially to see people get excited about their data when they try out this latest version.