Yesterday I delivered my Dashboard Design Do’s and Don’ts presentation as part of the 24 Hours of PASS event. I started by showing a disaster of a dashboard that highlighted the 13 common mistakes that Stephen Few discusses in his book, Information Dashboard Design. Then I explained several rules to live by when creating a dashboard and described an action plan for making over (or starting a new) dashboard. At the end of the presentation, I showed a simplified and revised version of the dashboard that applied the principles described during my presentation.
Because 60 minutes is a very short period of time to fully explore the Do’s and Don’ts, this post and others to follow will explore the various tips that I discussed (in no particular order) and show the “Before” and “After” shots of dashboard elements used in the demonstrations. The focus of today’s post is on the type of measurement you use in a chart.
My dashboard examples in the presentation use sales data for the fictional AdventureWorks company. Furthermore, I used SharePoint 2013 and SQL Server 2012 Reporting Services to produce the examples, although it’s possible to use earlier versions (or even other software) to produce similar results in most cases. Most of the elements in my first dashboard are Reporting Services web parts because I can manage the exact look and feel for a chart by using Reporting Services. Plus I have many more options for data sources.
Because a dashboard is often used to measure progress towards goals, one of the items in my dashboard compares actual sales (blue line) to the sales quota (orange line) over a period of time on a scale of absolue dollars:
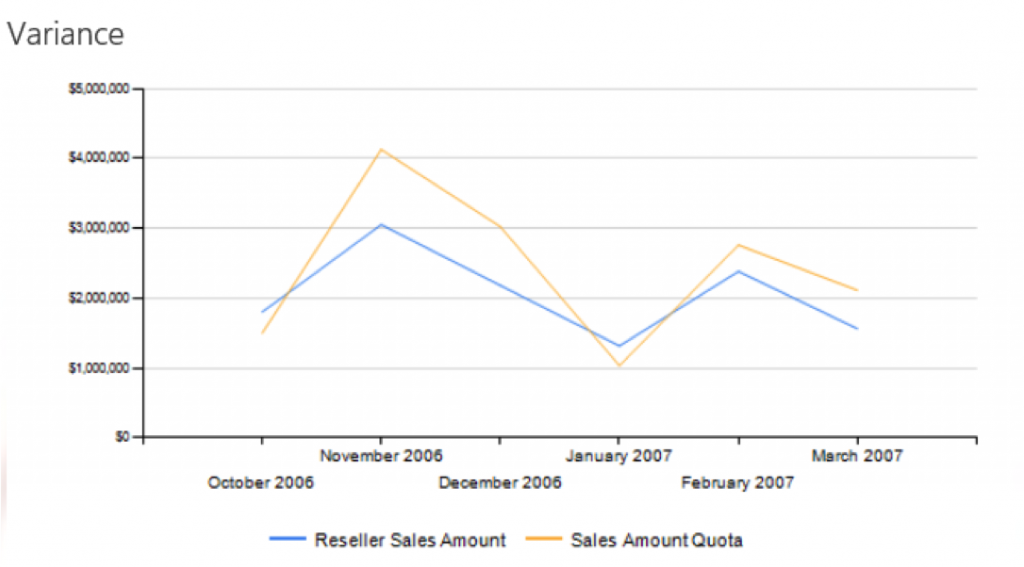
At a glance, you can see there are trends for both sales and quota values that track together generally in the same direction. Much of the time, sales are below the quota, while only twice do we see sales above quota. However, it’s difficult to gauge the relative difference. Is the difference a lot or a little? Of course, a lot or a little can be subjective values, but we can probably agree that a 60% variance would be a lot while a 5% variance would be a little. Regardless, we cannot describe those relative differences by looking at this chart. At least not very easily, which defeats the purpose of a dashboard.
As I mentioned in my presentation yesterday, a dashboard should present information in such a way that I can glance at it and understand what I need to know immediately. In the chart above, I immediately understand that in general sales are not meeting quotas. But if I want undertand by how much (i.e. the relative difference), my eye has to travel to the left to find the scale value for two different points and do the math. Of course, if I’m going to go to that much trouble, I really care about the value, right?
To make it easier to arrive at the value of interest – the variance, we need a chart that shows that value like this:
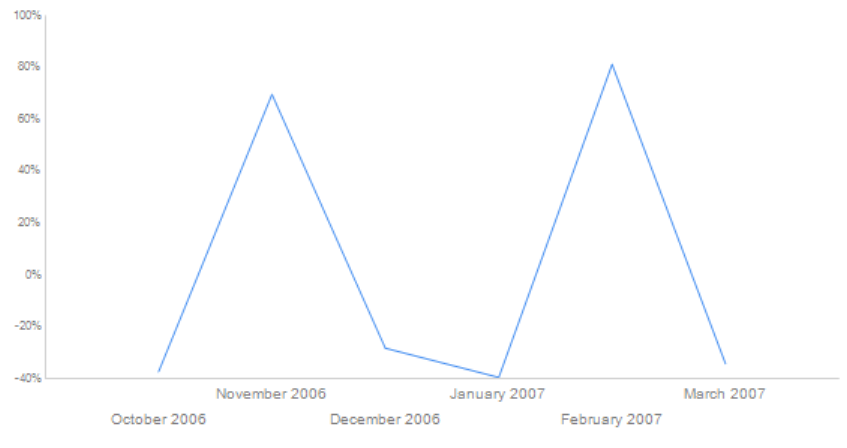
Now although this chart is a better chart for seeing the swings in variance over time, it didn’t make it into the final dashboard. At least not the one that I showed yesterday. I reserve the right to fine-tune the dashboard as I progress through this blog post series! After all, a dashboard is allowed to evolve based on user feedback.
In fact, to set the stage for future posts leading to the final dashboard, let’s review the makeover plan:
- Identify the dashboard type and audience
- Identify the metrics
- Select the visualization
- Add support and interaction
- Keep it simple
For steps 1 and 2, I interviewed the fictional AdventureWorks sales managers. (An easy interview, by the way…I get to make up my own requirements for a change, so just roll with me here…) As a result, I determined the goal of the dashboard makeover is to produce an analytic dashboard for the sales management team. Together, we also identified a limited number of metrics as the focus of the dashboard: sales variance by product mix and margins by territory.
That means many of the items in the original dashboard will get eliminated, at least from this first dashboard. However, they instead become candidates for other dashboards having different requirements, so stay tuned as we explore in future posts how to fix common mistakes.
Bottom line for today–be clear about what you’re measuring and what the user really needs to know. If there is a relationship between two measurements that you’re tracking, such as an actual value and a target value, it’s sometimes better to display that relationship as a percentage rather than use separate bars or separate lines to compare the values side by side. Common scenarios to which this would apply would be showing sales versus quota, expenses versus budget, or sales versus costs.
Continue to follow this series with Dashboard Design Tip #2: Use Scales Correctly.
2 Comments
[…] next tip in my dashboard makeover series (which began here) shows how information can be skewed when you alter the scale. One of the features introduced in […]
[…] time again for another tip in my dashboard makeover series (which began here). A common approach to producing dashboards is to reuse existing reports. After all, build it once […]