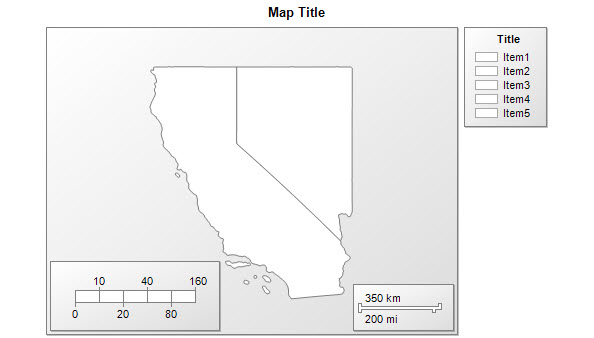
In SQL Server 2008 R2 Reporting Services, you can now create maps for reports using the built-in map gallery of the United States or individual states, ESRI shapefiles, or a spatial query. In a previous post, I explained how to obtain an ESRI shapefile for another country and convert it into spatial data so that you can have other maps available in the map gallery. In this post, I’ll show you how to create one map from multiple ESRI shapefiles. Whether you add it to the map gallery or not is up to you!
Obtaining State Shapefiles
To start, the process is similar to the one I described in my previous post on working with spatial data. This time my goal is to create a map of two states – Nevada and California. The best place to download free shapefiles for US states is the U.S. Census Bureau where I used the link to download by state. I found the Nevada directory and then used the topmost directory 32 where there many files to download. I chose tl_2010_32_state00.zip. Similarly in the California directory, I used the topmost directory to find and download tl_2010_06_state00.zip. Then I extracted each zip file to its own directory on my computer. They each contain a variety of files, including SHP and DBF files that I could use for a map using the ESRI shapefile data source option if I want to create a separate map for each state. But I want to combine these maps, so my mission is not yet complete.
Converting Shapefiles to SQL Spatial Data
My next step is to use a tool called Shape2SQL to extract the spatial data from the shapefile into a SQL Server table. Pinal Dave (blog|twitter) has a tutorial explaining how to do that. I had the same experience that I described in my last post – I had to clear the Create Spatial Index checkbox to get the table to load properly for the first state. When I loaded the second state, I had to clear the Replace Existing Table checkbox. Now I have both states in a table called State, as shown below, with a geom column having the SQL Geometry data type.
Creating the Multi-State Map
Now that I have my spatial data in a table, I’m ready to create the map. In Business Intelligence Development Studio, I added the map to my report which launched the Map Wizard and then I used the following steps:
- On the Choose a source of spatial data page of the wizard, select SQL Server spatial query, and click Next.
- On the Choose a dataset with SQL Server spatial data page, select Add a new dataset with SQL Server spatial data.
- On the Choose a connection to a SQL Server spatial data source page, select New.
- In the Data Source Properties dialog box, on the General page, add a connecton string like this (changing your server name if necessary):
Data Source=(local);Initial Catalog=SpatialData - Click OK and then click Next.
- On the Design a query page, add a query for the country shape, like this:
SELECT NAME00, geom FROM State - Click Next. The map wizard reads the spatial data and renders it for you on the Choose spatial data and map view options page, as shown below.
Of course, you can use these technique with any shapefiles that you can locate. It’s not limited to the United States. For example, if you want to create a map of multiple European countries or a combination of states in India, you could use a similar process by downloading shapefiles from either the Global Administrative Areas spatial database or the Natural Earth database.
