 It’s the second Tuesday of the month, so that means it’s T-SQL Tuesday! This month’s host is Jes Borland (blog | twitter) and the topic is Aggregate Functions.
I agree with Doug Lane (blog | twitter), who pointed out in his T-SQL Tuesday post that it’s best if you use the database engine to calculate aggregates rather than use aggregate functions in Reporting Services. There are some things the database engine can simply do better, and we should use the best tool for the job. But an even better way to work with aggregated data, in my opinion, is to put data into a cube and let Analysis Services do the calculations. Either way, whether you use a relational source like SQL Server or a multidimensional source like Analysis Services, the point is that the back-end engines will always outperform Reporting Services. On the back-end, Analysis Services should outperform SQL Server if the cube and the report query are both designed properly.
That said, there is some trickiness involved when retrieving and using aggregations in reports. I was having a déjà vu moment as I was writing this blog and sure enough I found that I had touched on the subject several years ago in my blog post, Showing Server Aggregations in Reporting Services. The post was written in reference to Reporting Services 2005, but the principles still apply. In today’s post, I’ll revisit the same query but add in some pictures this time to help clarify.
The Problem
If I create a table using the query from the referenced post, and if I add a total row using the Reporting Services SUM function, I get this result:
The SUM function would work just fine if I were to use an additive measure, like SalesAmount, but the SUM function doesn’t work at all with non-additive measures like Gross Profit Margin. It adds up the percentage values to produce the total row value but it really needs to compute the sum of sales and the sum of costs separately and then do the math to compute the correct result.
The Solution
Instead of using the SUM function, we can use the AGGREGATE function instead. That is we replace this expression:
=Sum(Fields!Gross_Profit_Margin.Value)
with this expression:
=Aggregate(Fields!Gross_Profit_Margin.Value)
Where’s the Value?
When I make the change to the expression and preview the report, I find that I have a new problem – the total row is now missing a value completely!
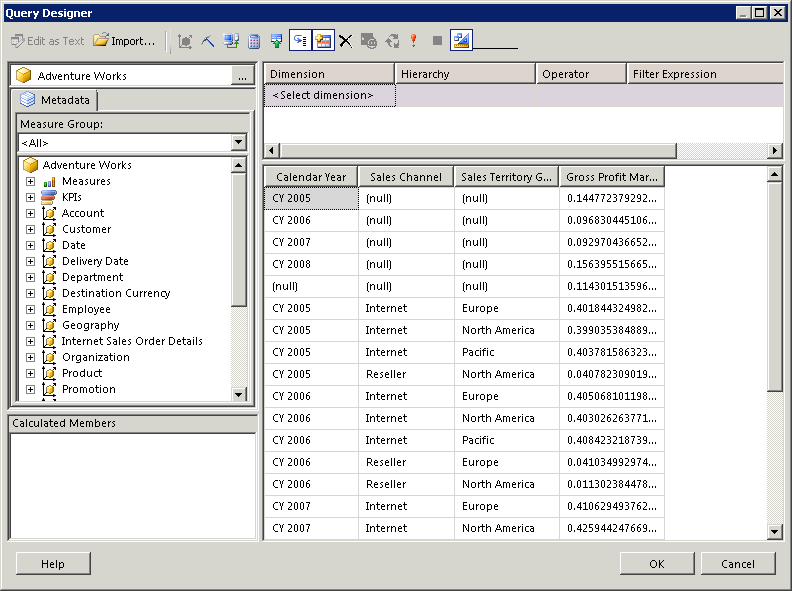
The reason is that the Aggregate function requires me to use a query in design mode only, not in query mode. (At least that’s the case in Reporting Services 2008 R2. I don’t remember that this was true in Reporting Services 2005, but I don’t have an instance for that version handy at the moment to try it out. I think, from reading my prior post, that it worked in either mode, but I can’t prove it at the moment!) In other words, I can’t write the MDX manually in query mode – I must use the drag-and-drop interface to create my query. That’s fine for simple queries, but it won’t work when you need to add in calculations or otherwise make adjustments to the auto-generated query.
The Complete Solution
So once I switch the query to design mode like this:
And then preview the report, I now get the desired result.
As I mentioned above, this will only work when the query is in design more. And there’s another requirement–the tablix must have at least one group defined. The benefit, though, is a faster report than you’ll get from running a comparable relational query. You won’t notice the difference in the AdventureWorks databases, but in that case, Reporting Services will perform aggregate functions reasonably well anyway. But if your data source has high volumes of data, then using a combination of cubes and Reporting Services will deliver much faster reports.


7 Comments
Thanks for sharing, very interesting and well written!
Stacia,
Do you know why SSRS won’t allow the aggregate function if not in query mode? I ran into this problem in 2008 and ended up using custom code to make the calculations simpler.
Hi Frank,
I’m not sure what happened, and was puzzled initially because I was pretty certain it worked in prior versions. My guess – with absolutely no proof whatsoever – is that it has something to do with the change to the query designer between 2005 and 2008. You might have noticed that we don’t get color-coded keywords in 2008 and later and the font is smaller, etc. It makes working in query mode a lot less friendly, in my opinion. My understanding is that Microsoft switched out to using a Visual Studio dialog box for the interface. It could be that the aggregate function was a casualty of that change. Or it’s a bug. 🙂 I don’ t know if the change was by design or not.
Cheers,
Stacia
Hi Stacia,
In fact, it works in query mode too in 2008R2. But, I have to admit that the way that RS and AS work together when you want to use aggregate function is very difficult to perfectly understand and I have struggle very long time to make one sample report running in this way.
In query mode you need to write MDX by referencing each level of the hierarchies from the top one to the deepest one want to display in your report, even you don’t need to use all these ones. As an example you have to put Year, Quarter and Month to be sure to display Month and be able to use aggregate function.
Hope this help (and hope my english is almost understandable)
Hi Romuald,
It’s good to know that this technique DOES work in query mode after all. I have to admit it’s not something I use frequently, so I’d forgotten that all levels of the hierarchy need to be included. Thanks for the reminder. And your English is quite understandable!
Hi Stacia
I am still facing this problem even though I am using VS 15 and SQL 2016. We are getting blank in the SSRS Tablix cell. Is there any way in which you can help us ? Is there any book which gives a more detailed explanation of this issue and its resolution ?
Kind Regards
Sanjay
I am not aware of any book that provides a more detailed explanation and resolution, although that doesn’t mean it doesn’t exist. I just tried the example with VS 15/SQL 2016 with an SSAS tabular model and was able to correctly use the Aggregate function, but I was using MDX to query the model. However, if I use DAX, I get an empty cell. Please note that when I wrote this article, I was referring to a multidimensional model which can only use MDX. If you need the server aggregates in your report and using DAX, you are going to need to write the DAX query to return the rows – details and aggregate values – that you need and present all rows in the detail rows of a query.