This year I’ve been busy producing two new courses at Pluralsight covering Power BI from two different perspectives. One course is for the complete novice and the other course is for anyone who wants to delve deeper into Power BI data modeling concepts.
If you don’t have an account at Pluralsight yet, no worries! You can sign up for a free trial with unlimited access!
Building Your First Power BI Report
If you are brand new to Power BI, start with Building Your First Power BI Report. It takes 1 hour and 37 minutes to watch all the videos in this course at a normal speed.
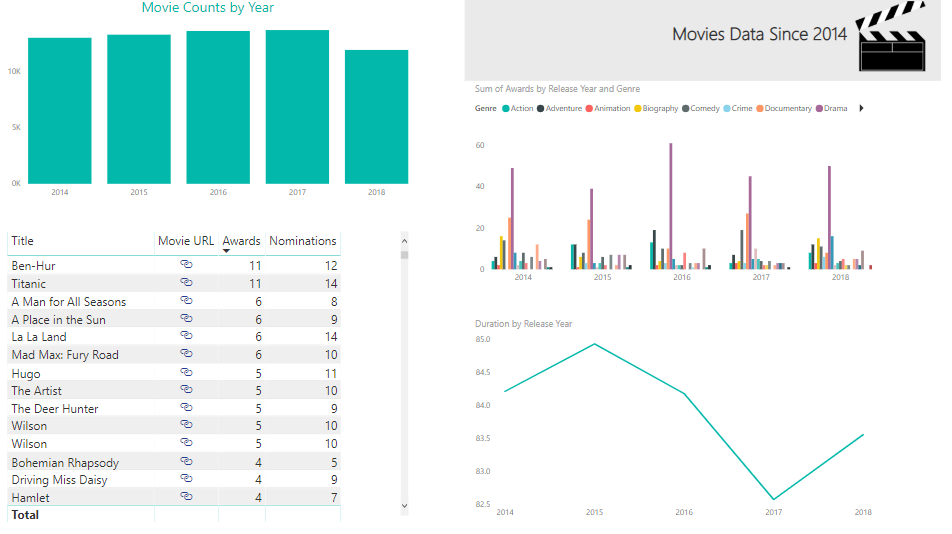
This course takes you on a tour of the Power BI Desktop application using a single source of data, an Excel spreadsheet containing movie data that I downloaded from IMDB.com using their free API and filtered down to a reasonably-sized data set.
I blended the resulting data set with some Academy Awards data to add counts of awards and nominations so that we had numeric data to plot in charts. (Psst: I used Power Query (aka Get Data) in Excel to merge the IMDB data with Academy Award data from Wikipedia and Best Picture data from Filmsite.org.)
Using this simple data set, I teach you how to:
- Import an Excel workbook into Power BI. Data is rarely ready to use for reporting immediately after an import. Therefore, I’ll also show you the simple steps necessary to fix your data so that it is more usable. That means you’ll learn how to filter out extraneous columns and rows and how to rename columns. You’ll also learn a few more advanced techniques necessary to fix this particular data set. More specifically, I teach you about duplicating a query, splitting a single column into multiple columns, transposing columns into rows (aka unpivoting), and data cleansing techniques.
- Model the data to improve the reporting experience. To do this, I’ll introduce the concept of table relationships, show you some of the properties that you can manage in the Power BI data model, and teach you about the DAX language that is used to add calculations to your model.
- Add data visualizations and static report elements to a report. Now we get to the good stuff! Power BI allows you to explore your data from multiple perspectives, so I’ll show you how to set up different views of the same data using a table as well as column and line charts. To wrap up, you learn how to publish your work to the Power BI web service and create a dashboard.
Modeling Data in Power BI
If you’ve already started using Power BI and want to explore more advanced features, especially with regard to combining multiple, disparate types of data, I have another course for you to view, Modeling Data in Power BI. This course is nearly 5 hours long when played at a normal speed.
In this course, the focus is on getting data from multiple sources into Power BI, applying a variety of transformations to blend the data together, and then modeling the data to better support data exploration in reports. Although I create visualizations in reports, I do not spend much time explaining about how to use these visualizations or how to take advantage of the various reporting features. The reports are here to validate the work performed to prepare the data model.
The data set is also related to movies, but consolidates a variety of sources to illustrate the areas in which Power BI handles some transformation steps for you and those in which you need to do more work to prepare the data. Specifically, I use the following sources in this course:
- A group of TSV files (like CSV files only using a tab as a delimiter), downloaded from IMDB.com and filtered down to a smaller set of data of movies and people. Primarily, I filtered the data based on movie release year. However, I also filtered the data to include only actors and directors, rather than all roles such as writers, producers, and so on. Otherwise, the data model would be HUGE! I also separated out names of people into different files to set up a demonstration in which you can import multiple files with the same structure as one query.
- A group of CSV files containing MovieLens data from the University of Minnesota. I was given written permission to use this data for demonstration purposes in this course, with the requirement that you must download the data directly from their web site. This set of data includes user-defined tags and ratings for movies.
- An XML file containing movie-related data from a Stanford professor’s course on data modeling. I included this data to demonstrate some challenges and solutions to working with XML data.
- HTML data related to the Stanford XML data in order to include information about awards and to illustrate yet another type of data source.
With this more complex collection of data sets loaded into Power BI, I teach you how to perform the following tasks:
- Combine data sets into fewer queries
- Filter the data to include only the rows and columns you need
- Expand XML
- Use Custom Columns to convert data types and concatenate strings
- Duplicate and reference queries
- Unpivot data to create new rows from columns in a single row
- Use a custom function to expedite the process of expanding XML
- Cleanse data
- Add proper relationships between tables
- Configure model properties to control visibility, sorting, formatting, and summarization
- Work with data categories
- Use synonyms
- Edit the Q&A linguistic schema
- Work with DAX in calculated columns, measures, and parameters
- Explore the effect of row and filter context on DAX results
- Work with a parent-child hierarchy
Whew! That’s a lot to learn! The end result isn’t pretty because this course is not about Power BI reporting. I’ll even admit it’s not the most perfect data model, but I had to draw the line somewhere. Else it would be a ten-hour course! That said, any further changes to the data model would be part of a normal iterative process to fine-tune the model to suit specific reporting requirements.
Furthermore, this course covers a lot of advanced modeling concepts that you won’t find in my very first Power BI course published in 2016, Getting Started in Power BI. That older course is still mostly valid, but the product has added many more features since then. Keeping up with monthly updates to Power BI definitely keeps us all on our toes!
And if you’re still craving more Power BI content, there are also a lot of others available at Pluralsight. Go check them out!
6 Comments
I’ve taken your courses through PluralSight and they are great!
Do you have any training available or recommendations for using ArcGIS with Power BI?
Thanks, Charlie!
I haven’t done official training for ArcGIS with Power BI yet. It’s a great idea, though! Meanwhile, there are several videos on YouTube. I don’t know how good they are, but several are put together by Esri, so I would expect those to be helpful. Cheers!
Dear Stacia,
I followed this course on PluraSight – it was super instructive.
I created my first report (trip report), a table report, when one column shall be dedicated to a long description of the trip.
It’s basically taking the data on one ROW and showing it in a full PAGE view.
Let say that on one ROW of my report I have got:
TRIP ID, TRIP NAME, TRIP DATE, OTHER DETAILS
And I want that by clicking on OTHER DETAILS i will be able to open a more detailed view of this entity (itinerary, bookings etc..).
What is the best way to proceed. Do you have a sample on another Plurasight course? If so could you be so kind to orient me?
You probably have figured this out by now, but in case someone else has a similar question… The feature that you want to use is drillthrough. I don’t cover this feature explicitly in another course. However, this year I did update the Modeling Data in Power BI course at Pluralsight and I have a sample report that implements this feature. You can see it at work in the Loading Data: Modeling Requirements clip at about 1:06. In the exercise files that you download for that course, you can see the example in the power-bi-data-modeling\Globoticket folder. There is a Movie Details page and a Person Details page that is the target for the drillthrough.
your courses on Power BI are awesome. Please make more. Thank you.
Thanks! I have spent this year updating all of my Power BI courses at Pluralsight. Maybe something new next year, but we’ll have to wait and see!