It’s time again for another tip in my dashboard makeover series (which began here). A common approach to producing dashboards is to reuse existing reports. After all, build it once and reuse it many times, seems like a good idea, right? The problem is that a dashboard has a different purpose than a report, and you have to constantly question the purpose of the dashboard. Be clear on the message that must be communicated quickly and concisely. As an example, in the original Adventure Works dashboard that I introduced in my 24 Hours of Pass presentation Dashboard Do’s and Don’ts, you can use a table to display quarter-to-date sales like this:
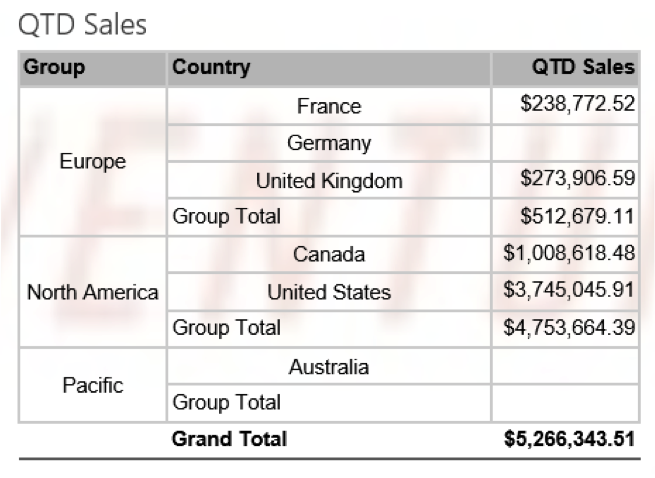
The problem is that this data in this format doesn’t help me know whether those values are good or bad. And of course I need to know what defines good or bad. Do I have a sales target to compare to? Do I want to know whether the quarter-to-date sales are better than the same time last quarter or the same time last year?
Let’s assume that there is an established sales target. Without the information in the dashboard, the viewer is forced to go look up a report that lists the forecasts by territory and then do calculations to figure out how close or far away each territory is from that goal. That defeats the purpose of the dashboard which should provide information at a glance. Consider the following chart as an alternative to showing a table.
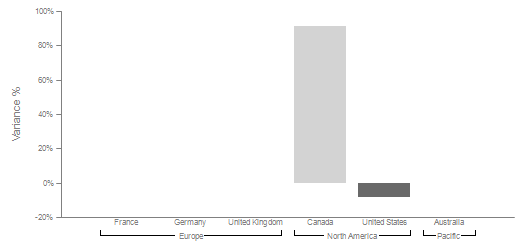
Here the only two countries for which a quarter-to-date sales target exists for the time frame represented are Canada and the United States. Notice that the column chart reflects the variance. You can see that Canada has sales that are almost 100% of the goal. Wow – not only did Canada meet its goal but has almost doubled the goal. Great news! On the other hand, the US is not meeting the goal. Whether that amount by which its not meeting the goal is a little or a lot depends on management expectations. The chart could be enhanced by adding a tooltip that displays the variance percentage value, the QTD sales, and QTD target to provide even more context without cluttering up the visualization.
This is just one way to present a visualization that provides context for sales. At a glance, it’s easy to tell where things are good and where things are not so good.
Want to learn more tips like these? Join me and a great lineup of speakers at the PASS Business Analytics Conference in Chicago on April 10-12. Here are some related sessions to help you build your skills:
- Advanced Dashboards Using Excel, Excel Services, and PerformancePoint
- Advanced Data Visualization with SQL Server Reporting Services
- Excel Charting Tips
Hope to see you there!

1 Comment
[…] Continue on with Dashboard Design Tip #3: Provide Context. […]